
Soil analysis: laboratory or real-time sensor?

Tório Barbosa · Founder, AI Agro
Published on September 4, 2026 · 13 min read
Quick answers
What you'll learn in this article
- The reach of the lab report: what chemical analysis measures, where it is irreplaceable and where it stops.
- What the sensor reads in real time: the variables monitored in the field and what continuous reading sees that the annual snapshot misses.
- The cost of each method: the lab's per-sample bill versus the sensor's one-time investment, with real figures.
- The ideal frequency and the combined calendar: when to repeat the report, when to read the sensor and how both fit into the season.
- The decisions that change with data on the spot: irrigation, cover crop, liming and fertilization, with real field cases.
Real-time soil analysis does not replace the laboratory report, and anyone who claims otherwise loses the trust of any technician. The two methods measure different things, at different rhythms, and the smart decision is to combine them to spend less on fertilizer, lime and pump hours.
This comparison puts the two side by side, with no favorites: what each one measures, what it costs, how often it enters management and what one sees that the other cannot reach.
The criterion here is cost. Before discussing yield ceilings, it pays to close the taps where money leaks out: leached nutrients, lime at the wrong rate and irrigation the crop never asked for.
What does laboratory analysis measure that the sensor cannot reach?
Laboratory soil analysis measures the full chemistry of the profile: pH, organic matter, phosphorus, potassium, calcium, magnesium, aluminum, CEC, base saturation and micronutrients, plus texture when requested. That report is what supports liming, gypsum and base fertilization recommendations.
The report is a high-resolution photograph. It shows, with official-method precision, the nutrient stock and the soil's capacity to hold what is applied — information no field sensor delivers.
Report quality starts with sampling. A composite sample needs several points per block, at the right depth and away from atypical patches, because the lab measures what reaches it, and poor sampling produces an expensive portrait of a soil that does not exist.
That photograph has a limit: it depicts the day of collection. Between one sampling and the next, the soil receives rain, irrigation, fertilizer and crop uptake, and all of it happens beyond the report's reach.
There is also turnaround time. Between collecting samples, shipping them to the lab and receiving results, the process usually takes days to a few weeks, and the decision that depended on that data waits along with it.
What does the soil sensor measure in real time?
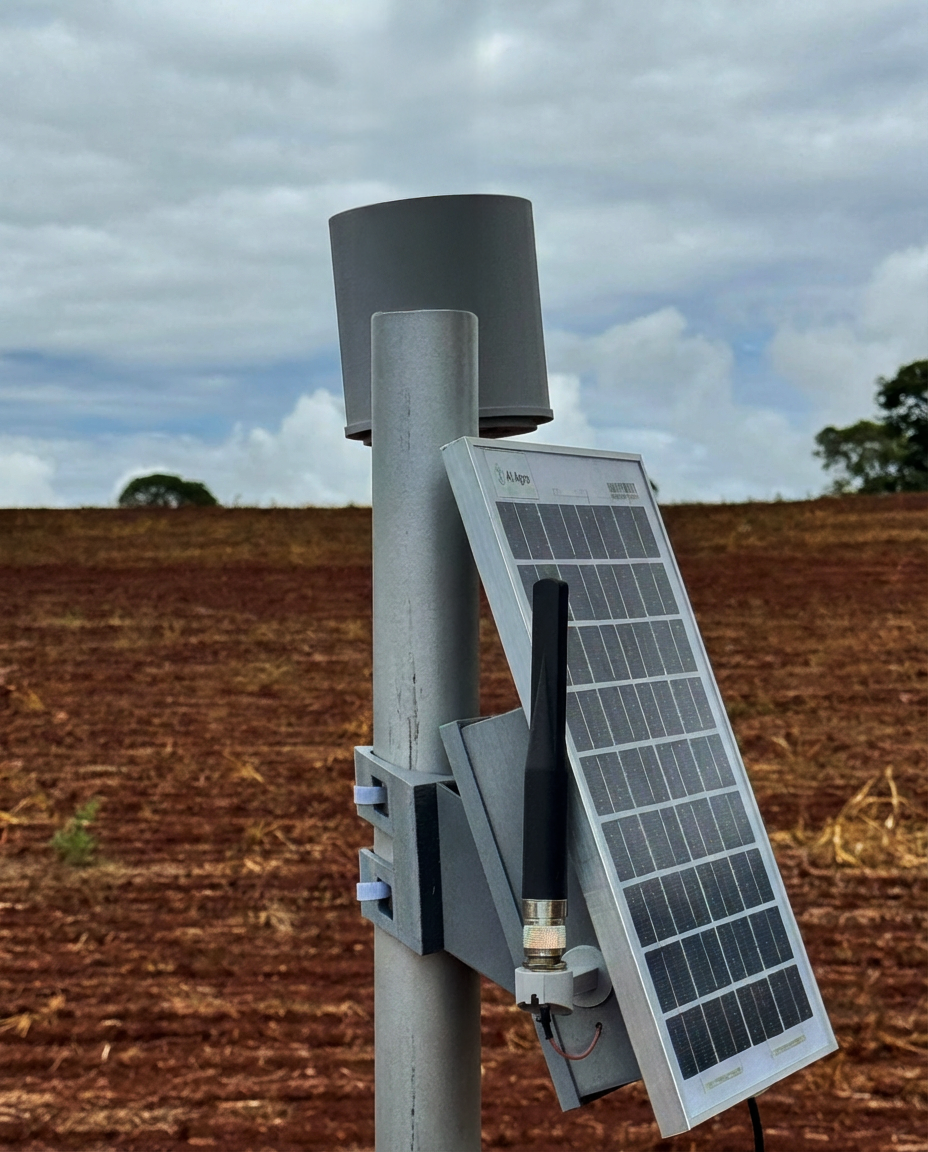
The sensor installed in the field continuously measures soil moisture and temperature, electrical conductivity, pH and nitrogen, phosphorus and potassium readings, together with the surrounding weather: air temperature, air humidity and accumulated rainfall. The AI Agro station interprets these readings with AI and sends the result via WhatsApp.
If the report is the photograph, the sensor is the film. The moisture curve shows the sawtooth between irrigations, electrical conductivity shows fertilizer rising after application and falling when water washes the profile, and pH shows acidification in progress.
Installation depth defines what the film shows. Measuring in the zone of highest root density reveals what the plant has available right now, and a second, deeper reading shows the water and nutrients that went straight through the profile — information no annual sampling captures.
Technical honesty matters here. The sensor's NPK readings are for tracking trends and comparing blocks, not for replacing the report's number: the absolute reference remains the laboratory, which in fact calibrates the interpretation of the sensor itself.
The interpretation layer comes with it. Instead of a spreadsheet of numbers, the station's AI turns readings into practical WhatsApp alerts: saturated soil, falling conductivity, recorded rainfall that makes the next irrigation unnecessary. The grower receives the suggested decision, not the homework.
What the sensor buys the grower is reaction time. A leaching event detected the same day costs a targeted correction, while the same event discovered months later, in the next report, has already become fertilizer paid for and lost.
How much does soil analysis cost with each method?
The lab charges per sample, and cost grows with area and frequency. On the public price list of the Unesp Registro laboratory, a basic analysis costs R$ 21.00 and a complete one R$ 40.00 per sample, at 2020 prices; commercial labs and other regions charge more.
The report's price, however, is only part of the bill. Add proper sampling at several points per block, travel, sample shipping and the time of whoever coordinates the process — costs that repeat with every sampling round.
In practice, an area with ten blocks sampled at two depths generates twenty reports per season. Even at university rates, that is R$ 420.00 to R$ 800.00 a year on analysis alone, before shipping and the team's field day, and the figure repeats season after season.
The sensor flips the logic: the investment is one-time and continuous reading has no per-measurement cost. The AI Agro station kit starts at R$ 700, and in the pre-sale of the next batch you reserve with a deposit deducted from the purchase.
Here is how the two methods line up side by side:
| Criterion | Laboratory | Real-time sensor |
|---|---|---|
| What it measures | Full chemistry: CEC, base saturation, organic matter, macro and micronutrients, texture | Moisture, temperature, electrical conductivity, pH and NPK trend, plus weather |
| Cost | Per sample, plus sampling and logistics, every round | One-time equipment, from R$ 700, no cost per reading |
| Frequency | One snapshot per season or per year | Continuous reading, the whole cycle |
| Time to data | Days to weeks after sampling | Minutes, straight to WhatsApp |
| What it cannot see | What happens between one sampling and the next | Total stock and the soil's exchange capacity |
Table: Comparison between laboratory analysis and real-time soil sensing on the criteria that weigh on the decision.
Placed in the same table, the methods stop competing. One measures stock with precision, the other measures movement with speed, and the numbers add up when each plays its part.
How often should you run soil analysis and read the sensor?
Lab analysis frequency varies with crop and system: the prevailing guidance in the market, as summarized in Bayer's technical material, is to repeat the report at intervals of a year or more. The sensor has no frequency; it has flow: it reads the soil all the time.
The combined calendar is born from that difference. The annual report comes in as the reference photograph, always taken at the same time of year to allow comparison between seasons, and the sensor fills in the film between one photograph and the next.
The division of roles is simple: the report sets the rates for liming, gypsum and base fertilization. The sensor watches execution: it confirms whether fertilizer stayed in the root zone, whether pH is moving and whether irrigation is giving the soil back only what the crop consumed.
Comparison between seasons only holds if the photograph is always taken the same way: same time of year, same depth, same sampling grid. Changing the sampling method midway breaks the historical series and turns real trends into sampling noise.
Two situations call for an off-calendar report: an area under acidity correction, to check whether the lime rate worked, and a persistent anomaly in the sensor curve, such as conductivity dropping with no apparent cause. In both, the film points to the moment and the lab delivers the verdict.
Whoever operates this way does not run more analyses; they run the same analyses with more return. Each report is checked against months of curve, and each anomaly in the curve earns a confirmation report at the right moment, not on a bureaucratic calendar.
Which decisions change when the soil is read in real time?
The decisions that change most with real-time soil analysis are the ones that depend on timing, not rate: when to irrigate, when to hold the cover crop, when to bring liming forward and when to investigate a nutrient loss. In all of them, watching the film changes the ending, because the window for action is short.
In irrigation, the center pivot case in Cristalina, Goiás shows the pattern: 90 days of moisture read continuously by depth, with every rainfall and irrigation event recorded. With that curve on screen, the unnecessary pump day shows up before it becomes an energy bill.
In cover-crop management, the Uniube center pivot in Uberaba, Minas Gerais tracks brachiaria alongside soil moisture, and the decision to keep or desiccate is made on data, not on an impression from the pickup truck.
In nutrition, Uniube's irrigated coffee follows moisture and nutrient trends across two crop phases. Falling electrical conductivity in the root zone exposes fertilizer moving down the profile, and top-dressing can be re-split before the loss is complete.
The same reasoning holds outside irrigation. In the sorghum in Tupaciguara, Minas Gerais, continuous soil and weather monitoring went into defining the harvest point, block by block, with data replacing visual estimates in the decision that sets the grain price.
In liming, monitored pH shows the right time to act: acidification appears in the curve months before the annual report, and the correction enters the plan instead of becoming an emergency. The same data is already training people: Uniube's agronomy class uses real station readings in the classroom.
For the agronomist serving a portfolio of farms, this is the closing argument: the recommendation no longer depends on the grower's memory of what happened between visits. The curve records everything, and the conversation starts from the data.
Where to start with real-time soil analysis?
The first step is not to abandon anything: keep the annual lab report exactly as it is, at the same time of year, with the same sampling grid. It remains the rate reference and the basis for comparison between seasons.
The second step is to install continuous reading where mistakes cost the most. An irrigated block, a pivot with a heavy energy bill or the field receiving the highest fertilizer rate are the natural candidates, because that is where the film pays for itself first.
The third step is to confront the two in the following season. Compare the new report with months of moisture, conductivity and pH curves, and the differences tell the story of what the photograph alone was hiding.
From there, the math is yours: add up what was saved in energy, repositioned fertilizer and liming done at the right time, and compare it with the cost of the equipment. To take the first step, get to know the AI Agro station and, if it makes sense for your area, reserve a unit from the next batch.
Founder, AI Agro
Founder of AI Agro, where he leads the architecture of a system that combines soil and weather sensors, IoT and AI agents to turn field data into irrigation decisions delivered to the grower's WhatsApp. Co-founder of Mkt4Edu and 4RevOps, he has 20 years of experience in operations and automation, serving 1,000+ clients across Brazil, the US, Mexico and the UAE.
See all articles